• For Individuals
  • For Businesses
  • For Universities
  • For Governments
Coursera
  • Log In
  • Join for Free
    Coursera
    • Browse
    • Plot Grafiken
    Skip to search results

    Filter by

    Subject
    Required
     *

    Language
    Required
     *

    The language used throughout the course, in both instruction and assessments.

    Learning Product
    Required
     *

    Build job-relevant skills in under 2 hours with hands-on tutorials.
    Learn from top instructors with graded assignments, videos, and discussion forums.
    Learn a new tool or skill in an interactive, hands-on environment.
    Get in-depth knowledge of a subject by completing a series of courses and projects.
    Earn career credentials from industry leaders that demonstrate your expertise.

    Level
    Required
     *

    Duration
    Required
     *

    Skills
    Required
     *

    Subtitles
    Required
     *

    Educator
    Required
     *

    Results for "plot (grafiken)"

    • C

      Coursera Project Network

      Crash Course on Interactive Data Visualization with Plotly

      Skills you'll gain: Plotly, Histogram, Interactive Data Visualization, Scatter Plots, Plot (Graphics), Data Visualization, Data Analysis, Python Programming

      4.8
      Rating, 4.8 out of 5 stars
      ·
      10 reviews

      Beginner · Guided Project · Less Than 2 Hours

    • Status: Free Trial
      Free Trial
      J

      Johns Hopkins University

      Foundations of Data Visualization

      Skills you'll gain: Data Presentation, Graphic and Visual Design, Data Storytelling, Design Elements And Principles, Plot (Graphics), Data Literacy, Exploratory Data Analysis, Scatter Plots

      Intermediate · Course · 1 - 3 Months

    • C

      Coursera Project Network

      Financial Analytics in RStudio: Identify Profit Drivers

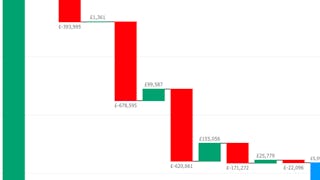
      Skills you'll gain: Operational Analysis, Performance Analysis, Performance Improvement, Data Import/Export, Variance Analysis, Exploratory Data Analysis, Data Analysis, Financial Analysis, Operations Management, Operating Expense, Plot (Graphics), Waterfall Methodology

      Intermediate · Guided Project · Less Than 2 Hours

    • Status: Free Trial
      Free Trial
      L

      LearnQuest

      Demand Forecasting Using Time Series

      Skills you'll gain: Time Series Analysis and Forecasting, Demand Planning, Trend Analysis, Data Visualization, Customer Demand Planning, Regression Analysis, Plot (Graphics), Matplotlib, Forecasting, Predictive Modeling, Correlation Analysis, Predictive Analytics, Applied Machine Learning, Supply Chain Management, Data Analysis, Exploratory Data Analysis, Pandas (Python Package), Statistical Modeling, Machine Learning, Python Programming

      3.3
      Rating, 3.3 out of 5 stars
      ·
      38 reviews

      Intermediate · Course · 1 - 4 Weeks

    • C

      Coursera Project Network

      Erstelle Grafiken für Facebook in Visme

      Skills you'll gain: Facebook, Social Media Strategy, Social Media, Social Media Marketing, Social Media Content, Graphic Design, Data Visualization, Content Creation, Advertising Campaigns

      Beginner · Guided Project · Less Than 2 Hours

    • C

      Coursera Project Network

      RStudio for Six Sigma - Control Charts

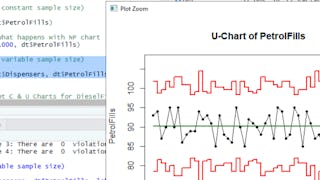
      Skills you'll gain: Statistical Process Controls, Six Sigma Methodology, Quality Control, Plot (Graphics), Data Literacy, Statistical Analysis, R Programming

      Beginner · Guided Project · Less Than 2 Hours

    • C

      Coursera Project Network

      Naive Bayes 101: Resume Selection with Machine Learning

      Skills you'll gain: Data Visualization, Matplotlib, Plot (Graphics), Exploratory Data Analysis, Text Mining, Applied Machine Learning, Data Cleansing, Scikit Learn (Machine Learning Library), Pandas (Python Package), Natural Language Processing, Predictive Modeling, Machine Learning, Data Processing, Unstructured Data, Data Analysis, Machine Learning Algorithms, Data Manipulation, Python Programming, Computer Science

      4.5
      Rating, 4.5 out of 5 stars
      ·
      17 reviews

      Intermediate · Guided Project · Less Than 2 Hours

    • C

      Coursera Project Network

      Building Statistical Models in R: Linear Regression

      Skills you'll gain: Exploratory Data Analysis, Statistical Modeling, Regression Analysis, Data Visualization, Data Analysis, Statistical Methods, R Programming, Statistical Analysis, Plot (Graphics), Predictive Modeling, Ggplot2

      4.7
      Rating, 4.7 out of 5 stars
      ·
      19 reviews

      Beginner · Guided Project · Less Than 2 Hours

    • Status: Free Trial
      Free Trial
      L

      LearnQuest

      Fundamentals of Machine Learning for Supply Chain

      Skills you'll gain: Exploratory Data Analysis, Data Wrangling, Operations Research, NumPy, Data Manipulation, Supply Chain, Data Transformation, Pandas (Python Package), Data Analysis, Data Cleansing, Data Science, Programming Principles, Python Programming, Applied Machine Learning, Plot (Graphics), Computer Programming, Data Structures

      3.8
      Rating, 3.8 out of 5 stars
      ·
      38 reviews

      Beginner · Course · 1 - 4 Weeks

    • C

      Coursera Project Network

      Erste Schritte in Visme

      Skills you'll gain: Graphic and Visual Design Software, Graphic Design, Design, User Accounts, Google Workspace, Marketing

      Beginner · Guided Project · Less Than 2 Hours

    • C

      Coursera Project Network

      Interactive Statistical Data Visualization 101

      Skills you'll gain: Plotly, Plot (Graphics), Data Visualization, Statistical Visualization, Box Plots, Scatter Plots, Interactive Data Visualization, Data Visualization Software, Histogram, Statistical Analysis, Data Analysis, Probability

      4.9
      Rating, 4.9 out of 5 stars
      ·
      9 reviews

      Beginner · Guided Project · Less Than 2 Hours

    • C

      Coursera Project Network

      تمثيل البيانات رسومياً باستخدام بايثون - Data Visualization

      Skills you'll gain: Plot (Graphics), Data Visualization, Graphing, Matplotlib, Data Visualization Software, Graphical Tools, Histogram, Data Analysis, Python Programming

      4.8
      Rating, 4.8 out of 5 stars
      ·
      48 reviews

      Beginner · Guided Project · Less Than 2 Hours

    1…8910…17

    In summary, here are 10 of our most popular plot (grafiken) courses

    • Crash Course on Interactive Data Visualization with Plotly: Coursera Project Network
    • Foundations of Data Visualization: Johns Hopkins University
    • Financial Analytics in RStudio: Identify Profit Drivers: Coursera Project Network
    • Demand Forecasting Using Time Series: LearnQuest
    • Erstelle Grafiken für Facebook in Visme: Coursera Project Network
    • RStudio for Six Sigma - Control Charts: Coursera Project Network
    • Naive Bayes 101: Resume Selection with Machine Learning: Coursera Project Network
    • Building Statistical Models in R: Linear Regression: Coursera Project Network
    • Fundamentals of Machine Learning for Supply Chain: LearnQuest
    • Erste Schritte in Visme: Coursera Project Network

    Other topics to explore

    Arts and Humanities
    338 courses
    Business
    1095 courses
    Computer Science
    668 courses
    Data Science
    425 courses
    Information Technology
    145 courses
    Health
    471 courses
    Math and Logic
    70 courses
    Personal Development
    137 courses
    Physical Science and Engineering
    413 courses
    Social Sciences
    401 courses
    Language Learning
    150 courses

    Coursera Footer

    Skills

    • Artificial Intelligence (AI)
    • Cybersecurity
    • Data Analytics
    • Digital Marketing
    • English Speaking
    • Generative AI (GenAI)
    • Microsoft Excel
    • Microsoft Power BI
    • Project Management
    • Python

    Certificates & Programs

    • Google Cybersecurity Certificate
    • Google Data Analytics Certificate
    • Google IT Support Certificate
    • Google Project Management Certificate
    • Google UX Design Certificate
    • IBM Data Analyst Certificate
    • IBM Data Science Certificate
    • Machine Learning Certificate
    • Microsoft Power BI Data Analyst Certificate
    • UI / UX Design Certificate

    Industries & Careers

    • Business
    • Computer Science
    • Data Science
    • Education & Teaching
    • Engineering
    • Finance
    • Healthcare
    • Human Resources (HR)
    • Information Technology (IT)
    • Marketing

    Career Resources

    • Career Aptitude Test
    • Examples of Strengths and Weaknesses for Job Interviews
    • High-Income Skills to Learn
    • How Does Cryptocurrency Work?
    • How to Highlight Duplicates in Google Sheets
    • How to Learn Artificial Intelligence
    • Popular Cybersecurity Certifications
    • Preparing for the PMP Certification
    • Signs You Will Get the Job After an Interview
    • What Is Artificial Intelligence?

    Coursera

    • About
    • What We Offer
    • Leadership
    • Careers
    • Catalog
    • Coursera Plus
    • Professional Certificates
    • MasterTrack® Certificates
    • Degrees
    • For Enterprise
    • For Government
    • For Campus
    • Become a Partner
    • Social Impact
    • Free Courses
    • Share your Coursera learning story

    Community

    • Learners
    • Partners
    • Beta Testers
    • Blog
    • The Coursera Podcast
    • Tech Blog

    More

    • Press
    • Investors
    • Terms
    • Privacy
    • Help
    • Accessibility
    • Contact
    • Articles
    • Directory
    • Affiliates
    • Modern Slavery Statement
    • Manage Cookie Preferences
    Learn Anywhere
    Download on the App Store
    Get it on Google Play
    Logo of Certified B Corporation
    © 2025 Coursera Inc. All rights reserved.
    • Coursera Facebook
    • Coursera Linkedin
    • Coursera Twitter
    • Coursera YouTube
    • Coursera Instagram
    • Coursera TikTok